Value Stream Mapping
The aim of Value Stream Mapping is to clarify logistic bottlenecks
and establish problems and opportunities in the total Value Stream . These
bottlenecks and problems/opportunities can be analysed then in more detail.
Value Stream Mapping is the starting point of a logistic analysis.
The Value stream Map is meant to make the organisation aware of the added
value steps in the total production and distribution chain. The Value Stream
Map is therefore different from the normal process schemes:
1. Different pictogrammes which are more illustrative
2. Focus on logistics and production
3. The Aggregation level is quite high: for a product family, the total chain
is often depicted from the supplier, via production and distribution, to the
client.
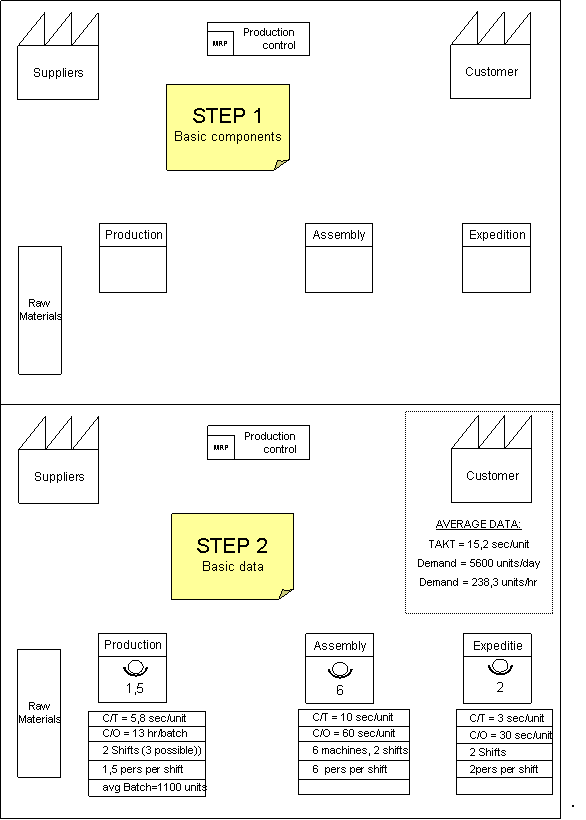
Value stream Mapping distinguishes 4 steps:
| Step 1 | Basic components |  |
| The basic components ("entities") are drawn on a sheet of paper. See the adjacent example of pictograms. | ||
| Step 2: | Basic data | |
| Collect the required data and add the data to the pictograms. C/T: Cycle time = the time which is required to produce one product in a production step C/O: Operation time = the throughput time of a product through a system Batch time, and delivery batch (to the client) Note. Relevant is the average time for a peak month, week or day. |
||
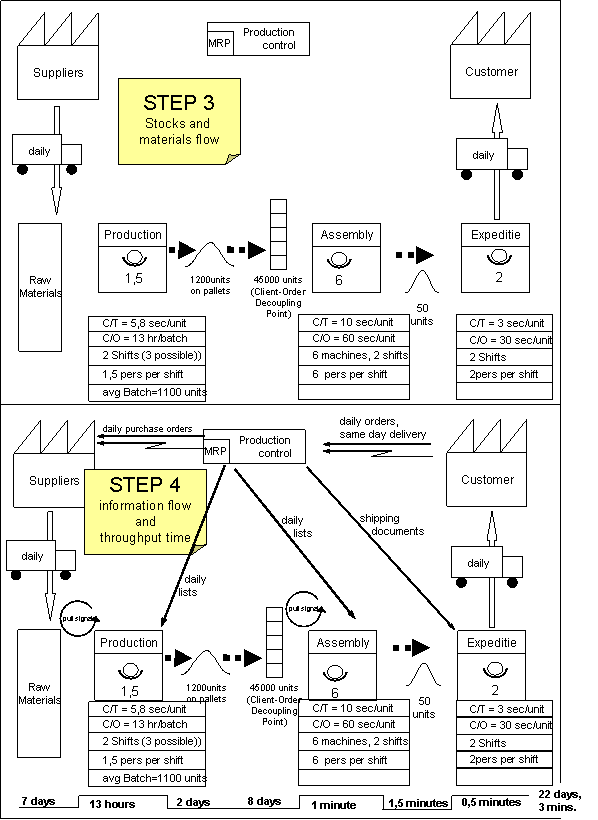
| Step 3: | Material flow and storage | |
| Add the materials flow and storage. Distinguish
between push (when a product is ready we push it into the storage to wait
for the following production step) and pull (we only process the product
when it is needed at the following production step). Distinguish between controlled storage and uncontrolled storage. |
||
| Step 4: | Information flow and thrhoughput time | |
| Add the information flows and the throughput times. Distinguish between electronic data flows and paper flows. The frequency of data flow is important (e.g. real time, each hour, each day, each week , each month........).. The throughput time comprises the following elements: - the throughput times (C/O) of the subsystems (production steps). - the average residence time in storage. Or the average time in a queue. The throughput time is divided by the Value Added and/or the Non Value Added. It is depicted at the bottom of the Value Stream Map, see the example below. |
An example of a Value Stream Analysis:

